Systematic Reviews & Meta-Analysis
How the boards test systematic reviews and meta-analysis: reading a forest plot (does the CI/diamond cross the line of no effect?), interpreting I² heterogeneity and fixed-effect vs random-effects models, and recognizing funnel-plot asymmetry as publication bias.
Overview: pooling for power
A systematic review answers a focused clinical question using explicit, reproducible methods — a predefined protocol, a comprehensive literature search, and standardized quality appraisal — to gather and synthesize all relevant studies while minimizing bias. A meta-analysis goes one step further: it statistically pools the quantitative results of those studies into a single summary (pooled) effect estimate. Not every systematic review contains a meta-analysis, and pooling is only valid when the studies are similar enough to combine.
Together they sit at the top of the evidence hierarchy, above any individual RCT. The payoff of pooling is greater statistical power and precision: combining many small, underpowered trials narrows the confidence interval and can reveal a true effect that no single study could detect. The catch — results are only as trustworthy as the studies fed in (garbage in, garbage out).
- Systematic review = structured qualitative synthesis; meta-analysis = quantitative statistical pooling → single summary estimate
- Highest level of evidence; main benefits = ↑ power and ↑ precision (narrower CI)
- Reported per PRISMA guidelines; protocol pre-registered on PROSPERO
- Forest plot = the visual output: each study = a box (point estimate; box size ∝ weight ∝ 1/variance) with horizontal CI whiskers; the bottom diamond = pooled estimate (its width = the pooled CI)
- Line of no effect = 1.0 for ratio measures (OR, RR, HR); 0 for difference measures (mean or risk difference)
- If a CI crosses the line of no effect → NOT statistically significant
- Publication bias (positive studies published more often) → overestimates the effect; screened with a funnel plot
- Validity is limited by included-study quality (GIGO) and by heterogeneity
Systematic review vs meta-analysis
| Feature | Systematic Review | Meta-Analysis |
|---|---|---|
| Core method | Structured, reproducible literature synthesis | Statistical pooling of study data |
| Output | Qualitative summary | Quantitative pooled estimate + forest plot |
| Requires combinable studies? | No | Yes — similar populations/outcomes |
| Handles bias via | Predefined protocol, broad search | Weighting; heterogeneity & publication-bias checks |
| Relationship | Can exist without a meta-analysis | Almost always sits within a systematic review |
Vignette: A meta-analysis of 8 RCTs compares a new anticoagulant vs warfarin for stroke prevention. On the forest plot, 3 individual study CIs cross 1.0, but the summary diamond lies entirely to the left of 1.0 (RR 0.82, 95% CI 0.74–0.91).
Interpretation / next step: The pooled estimate is statistically significant and favors the new drug (RR <1, CI excludes 1.0) — even though several individual trials were underpowered (their CIs crossed no-effect). This is the core value of meta-analysis: pooling increases power and precision, and the diamond — not any single study — drives the conclusion. Always read the diamond's position relative to the line of no effect first.

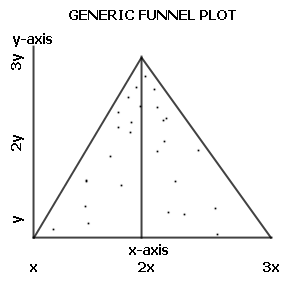
Vignette: Reviewers plot each trial's effect size (x-axis) against a measure of its size/precision (y-axis) — most often the standard error, plotted inverted so the largest, most precise trials sit at the top. The plot is asymmetric, with small null/negative studies missing from one lower corner.
Diagnosis: Publication bias — small studies with unfavorable results went unpublished (the 'file-drawer' problem). A symmetric inverted funnel would instead suggest no bias.
Next step / consequence: Asymmetry means the pooled effect is likely overestimated. Confirm suspected asymmetry statistically with Egger's test, and interpret the summary estimate with caution.
- Heterogeneity = variability across study results beyond chance (clinical, methodological, or statistical)
- Quantified by I² = % of total variation due to heterogeneity rather than chance (Cochrane rough guide):
- 0–40% may be unimportant · 30–60% moderate · 50–90% substantial · 75–100% considerable
- Cochran's Q (chi-square) tests whether heterogeneity exists but is low-powered
- Fixed-effect model: assumes one single true effect; all variation = within-study sampling error → narrower CI
- Random-effects model: assumes the true effect varies across studies; adds between-study variance (τ²) → wider, more conservative CI
- High I² → favor random-effects, explore sources with subgroup/sensitivity analysis, or don't pool at all
Fixed-effect vs random-effects model
| Feature | Fixed-Effect Model | Random-Effects Model |
|---|---|---|
| Assumption | One single true effect | True effect varies across studies |
| Source of variation | Within-study (sampling) only | Within- and between-study (τ²) |
| Confidence interval | Narrower | Wider (more conservative) |
| Relative small-study weight | Lower | Relatively higher |
| Best used when | Studies homogeneous (low I²) | Heterogeneity present (high I²) |
PICO — how a systematic review frames its focused question:
- P — Population / Patient
- I — Intervention
- C — Comparison / Control
- O — Outcome
GIGO — 'Garbage In, Garbage Out': a meta-analysis can never be better than the studies it pools. Combining biased or low-quality trials just yields a precise-looking but misleading summary estimate.
Practice Research Methods now
Board-style questions, spaced-repetition flashcards, and a Socratic AI tutor — free to start.