Survival Analysis & Kaplan-Meier
A boards-focused walkthrough of Kaplan-Meier survival curves — reading the step function, censoring, median survival, the log-rank test, and Cox-derived hazard ratios, with vignettes on median-survival and HR interpretation.
What survival analysis is
Survival analysis handles time-to-event data. The event is classically death but can be any binary event: relapse, MI, graft failure, or discharge. Two features break ordinary methods (t-test on mean survival): (1) subjects are followed for different lengths of time, and (2) censoring — many subjects have not had the event when the study ends or are lost to follow-up.
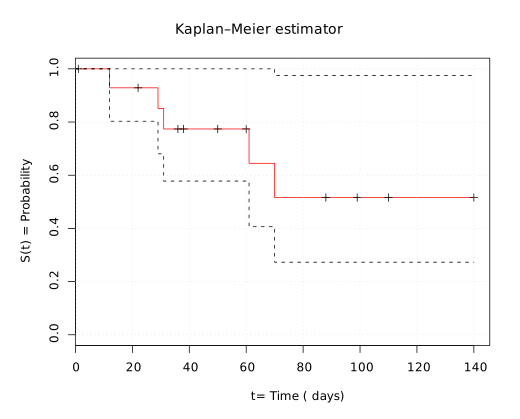
The Kaplan-Meier (KM) estimator computes the survival function S(t) = probability of remaining event-free beyond time t. It is drawn as a descending step function: the y-axis is the proportion still event-free (starts at 1.0), the x-axis is time. The curve steps down only at an event, never at a censoring point. Because censoring makes the mean survival unreliable, results are summarized by median survival.
- Y-axis = cumulative proportion surviving / event-free; starts at 1.0 (100%)
- X-axis = time to event
- Curve is a step function — each downward step = one or more events
- Vertical tick / hash marks = censored patients (still event-free at last contact) — the curve does NOT drop here
- Median survival = the time where the curve crosses S(t) = 0.50
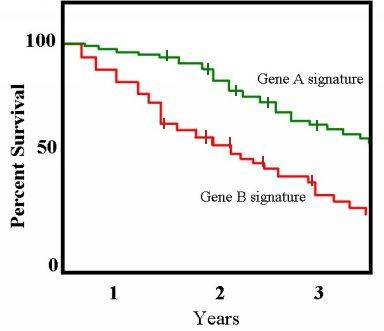
- When comparing two curves, the one that stays higher / further right = better survival
- Vertical gap between two curves = absolute difference in survival at that time point
- Censoring = the event was not observed during follow-up
- Right censoring (most common): the study ends, the patient is lost to follow-up, or withdraws before the event occurs
- Censored subjects still contribute to the denominator (at-risk set) up until the moment they are censored — they are not simply deleted
- Key assumption: non-informative (independent) censoring — dropout is unrelated to prognosis/risk of the event
- Informative censoring (e.g., the sickest patients drop out or die of other causes) → biased survival estimate
- Censoring is why you report median, not mean, survival
Log-rank test vs Cox proportional hazards
| Feature | Log-rank test | Cox proportional-hazards regression |
|---|---|---|
| Purpose | Compare 2+ whole survival curves | Estimate effect size + adjust for covariates |
| Output | p-value only (no effect size) | Hazard ratio (HR) with 95% CI |
| Adjusts for confounders? | No (unadjusted) | Yes (multivariable) |
| Null hypothesis | Curves are identical | HR = 1 |
| Key assumption | — | Proportional hazards (HR constant over time) |
Vignette: A phase III trial for metastatic pancreatic cancer plots KM curves for a new drug vs standard chemo. The new-drug curve crosses 50% survival at 14 months; the standard curve crosses 50% at 9 months. Small vertical tick marks appear along both curves.
Interpretation / answer:
- Median survival = time at S(t) = 0.50 → 14 months (new) vs 9 months (standard). Median is used because censoring makes mean survival invalid.
- The tick marks = censored patients (alive at last follow-up or lost) — they do not count as deaths.
Next best step (statistics): To test whether the entire curves differ, use the log-rank test. To quantify the benefit adjusted for stage/performance status, fit a Cox model to obtain the hazard ratio.
Vignette: In the same trial, a Cox proportional-hazards model reports a hazard ratio for death of 0.65 (95% CI 0.48–0.88) for the new drug vs standard chemo.
Interpretation / answer:
- HR 0.65 → at any given instant, treated patients have a 35% lower rate (hazard) of death than controls — a relative reduction over follow-up.
- The 95% CI (0.48–0.88) excludes 1.0 → statistically significant; the drug is protective (HR < 1).
- Common trap: an HR is NOT a risk ratio, an odds ratio, or an absolute survival difference. It does not mean 35% of patients are cured.
Takeaway: HR = 1 → no effect; HR < 1 → beneficial/protective; HR > 1 → harmful. Significance is judged by whether the CI crosses 1.
- HR interpretation: = 1 → no difference; < 1 → protective; > 1 → harmful
- HR is a relative rate of the event across follow-up — not absolute risk, odds, or a survival percentage
- HR is significant when its 95% CI excludes 1.0
- KM + log-rank = unadjusted; Cox = adjusts for confounders and yields the HR
- Curve steps down at events; ticks = censored (no drop)
- With censoring, report median survival, not mean
- Log-rank gives significance but NO effect size — pair it with Cox to get the magnitude
- Curve that is higher / shifted right = better survival
Practice Biostatistics now
Board-style questions, spaced-repetition flashcards, and a Socratic AI tutor — free to start.