Diagnostic Testing: Sensitivity, Specificity & Predictive Values
A tight, boards-focused walkthrough of the diagnostic 2×2 table: sensitivity and specificity as prevalence-independent test properties versus PPV/NPV as prevalence-dependent patient answers, plus cutoff trade-offs, likelihood ratios, ROC/AUC, and the SnNOUT/SpPIN rules.
The 2×2 table is the whole game
Every diagnostic test is judged against a gold standard using a 2×2 contingency table that sorts patients into four cells: true positives (TP), false positives (FP), false negatives (FN), and true negatives (TN). Two distinct families of numbers fall out of this table, and the boards live in the gap between them.
- Sensitivity & specificity describe the test itself. They are intrinsic — they do not change with disease prevalence.
- Predictive values (PPV/NPV) describe what a result means for the patient in front of you. They shift dramatically with prevalence.
Confusing these two families is the single most tested trap in this topic.
The master 2×2
| Disease + | Disease − | |
|---|---|---|
| Test + | TP | FP |
| Test − | FN | TN |
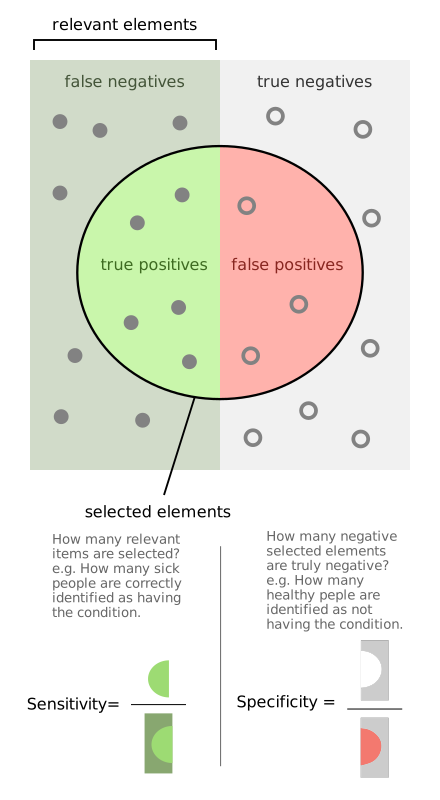
- Sensitivity = TP / (TP + FN) — proportion of diseased correctly flagged; a highly sensitive test has few false negatives
- Specificity = TN / (TN + FP) — proportion of healthy correctly cleared; a highly specific test has few false positives
- PPV = TP / (TP + FP) — chance a positive patient truly has disease; ↑ with prevalence
- NPV = TN / (TN + FN) — chance a negative patient truly is disease-free; ↓ with prevalence
- Sensitivity & specificity are prevalence-independent — intrinsic properties of the test
- Accuracy = (TP + TN) / total
Prevalence, cutoffs, and the trade-off
Because PPV and NPV depend on how common disease is, the same test gives a low PPV in a low-prevalence screening population (most positives are false positives) but a high PPV in a high-prevalence referral clinic — the test never changed, only the population did.
Moving the cutoff for a positive result trades one property for the other:
- Lowering the threshold → catches more disease → ↑ sensitivity, ↓ specificity (more false positives)
- Raising the threshold → ↑ specificity, ↓ sensitivity (more false negatives)
You cannot maximize both at once. The ROC curve (sensitivity vs. 1 − specificity) plots this trade-off, and the area under the curve (AUC) summarizes overall discrimination: 1.0 = perfect, 0.5 = coin flip.
- SnNOUT — a highly Sn (sensitive) test, when Negative, rules disease OUT
- SpPIN — a highly Sp (specific) test, when Positive, rules disease IN
- Predictive values (PPV & NPV) hinge on Prevalence — same test, different population, different post-test answer
Side-by-side comparison
| Feature | Sensitivity | Specificity | PPV | NPV |
|---|---|---|---|---|
| Formula | TP/(TP+FN) | TN/(TN+FP) | TP/(TP+FP) | TN/(TN+FN) |
| Reads the... | Disease + column | Disease − column | Test + row | Test − row |
| Prevalence-dependent? | No | No | Yes (↑) | Yes (↓) |
| Best use | Screening / rule out | Confirmation / rule in | Interpret + result | Interpret − result |
| Rule | SnNOUT | SpPIN | — | — |
- LR+ = sensitivity / (1 − specificity); > 10 strongly rules disease in
- LR− = (1 − sensitivity) / specificity; < 0.1 strongly rules disease out
- Likelihood ratios are prevalence-independent (like sens/spec) and multiply pre-test odds → post-test odds (post-test odds = pre-test odds × LR)
- LR = 1 → useless test (no change from pre-test probability)
- ROC curve: sensitivity (y-axis) vs. 1 − specificity (x-axis); the upper-left corner is ideal, and a larger AUC = better test
Classic tested moves:
- Screening a low-prevalence population (e.g., HIV) → start with a highly sensitive test (4th-generation antigen/antibody combination immunoassay, which detects p24 antigen + HIV-1/2 antibodies) so you miss almost no cases, then confirm reactive results with a highly specific test (the HIV-1/2 antibody differentiation immunoassay; the older Western blot has been retired from the current CDC algorithm) to purge false positives.
- "A test's PPV rises when moved to a sicker clinic population" → prevalence effect, not a change in the test.
- "Lowering the glucose cutoff for diabetes screening" → ↑ sensitivity, ↓ specificity → more false positives.
- A negative highly-sensitive test in a symptomatic patient → confident enough to rule out (SnNOUT); a positive highly-specific test → confident enough to rule in (SpPIN).
Practice Biostatistics now
Board-style questions, spaced-repetition flashcards, and a Socratic AI tutor — free to start.