Cardiovascular Hemodynamics & Blood-Pressure Regulation
A Step 1–focused walkthrough of cardiovascular hemodynamics (MAP = CO × TPR, Poiseuille, pulse pressure, Guyton curves, PV-loop levers) integrated with the neural and hormonal loops that regulate blood pressure and the classic disease correlations they explain.
Hemodynamic fundamentals: the master equation
Blood flow obeys an Ohm's-law analog: Flow (Q) = ΔP / R. For the whole circulation the flow is cardiac output, the driving pressure is roughly MAP − right atrial pressure (≈ MAP), and R is total peripheral resistance — giving the equation the boards live on: MAP = CO × TPR.
Resistance follows Poiseuille's law, R = 8ηL / (πr⁴), so it scales with blood viscosity (η) and vessel length but is exquisitely sensitive to radius: halving a vessel's radius raises its resistance 16-fold. That is why arterioles — the vessels richest in smooth muscle — are the principal resistance vessels, the site of the steepest pressure drop, and the main point of blood-flow regulation.
MAP is not the simple average of systolic and diastolic pressure, because at rest the heart spends ~2/3 of each cycle in diastole: MAP ≈ DBP + ⅓(SBP − DBP). Pulse pressure = SBP − DBP and is set by stroke volume and arterial compliance (it widens when a stiff, aged aorta loses compliance). Finally, veins are high-capacitance vessels holding ~65–70% of total blood volume, while capillaries have the largest total cross-sectional area — so velocity is slowest there, ideal for exchange.
- MAP = CO × TPR; CO = SV × HR; normal CO ≈ 5 L/min (SV ~70 mL × HR ~70)
- MAP ≈ ⅔·DBP + ⅓·SBP = DBP + ⅓(pulse pressure); ~93 mmHg for a 120/80 BP
- Pulse pressure = SBP − DBP ∝ stroke volume ÷ arterial compliance
- R = 8ηL / (πr⁴) → R ∝ 1/r⁴; arterioles = primary resistance + regulation site
- Fick principle: CO = O₂ consumption / (arterial O₂ content − venous O₂ content)
- Ejection fraction = SV / EDV (normal ≥55%); SV = EDV − ESV
- Viscosity ↑ with polycythemia / hyperproteinemia, ↓ with anemia → alters resistance
- Resistances in series add; in parallel total falls (capillary beds are in parallel)
- Velocity lowest in capillaries (largest total cross-sectional area); veins hold ~⅔ of blood volume

Across the vascular tree: pressure, area, velocity, resistance
| Segment | Pressure | Total cross-sectional area | Flow velocity | Functional role |
|---|---|---|---|---|
| Aorta / large arteries | Highest, most pulsatile | Small | Fastest | Conduit; compliance buffers the pulse |
| Arterioles | Steep pressure drop | ↑ | Slowing | Largest resistance; regulate flow & MAP |
| Capillaries | Low | Largest total area | Slowest | Exchange; arranged in parallel |
| Venules → veins | Lowest | Large | Increasing | Capacitance — hold ~65–70% of blood volume |
Determinants of stroke volume & the Guyton curves
Stroke volume is governed by three levers — preload, afterload, and contractility.
Preload ≈ end-diastolic volume / end-diastolic wall stress; it rises with venous return, fluid loading, and bradycardia (more filling time). By the Frank-Starling mechanism, greater sarcomere stretch increases contractile force (better actin–myosin overlap and length-dependent Ca²⁺ sensitivity), so SV climbs with preload.
Afterload ≈ the pressure/wall stress the ventricle must overcome to eject (aortic pressure/TPR; wall stress = P·r / 2h by Laplace). Raising afterload lowers SV acutely and drives concentric hypertrophy chronically.
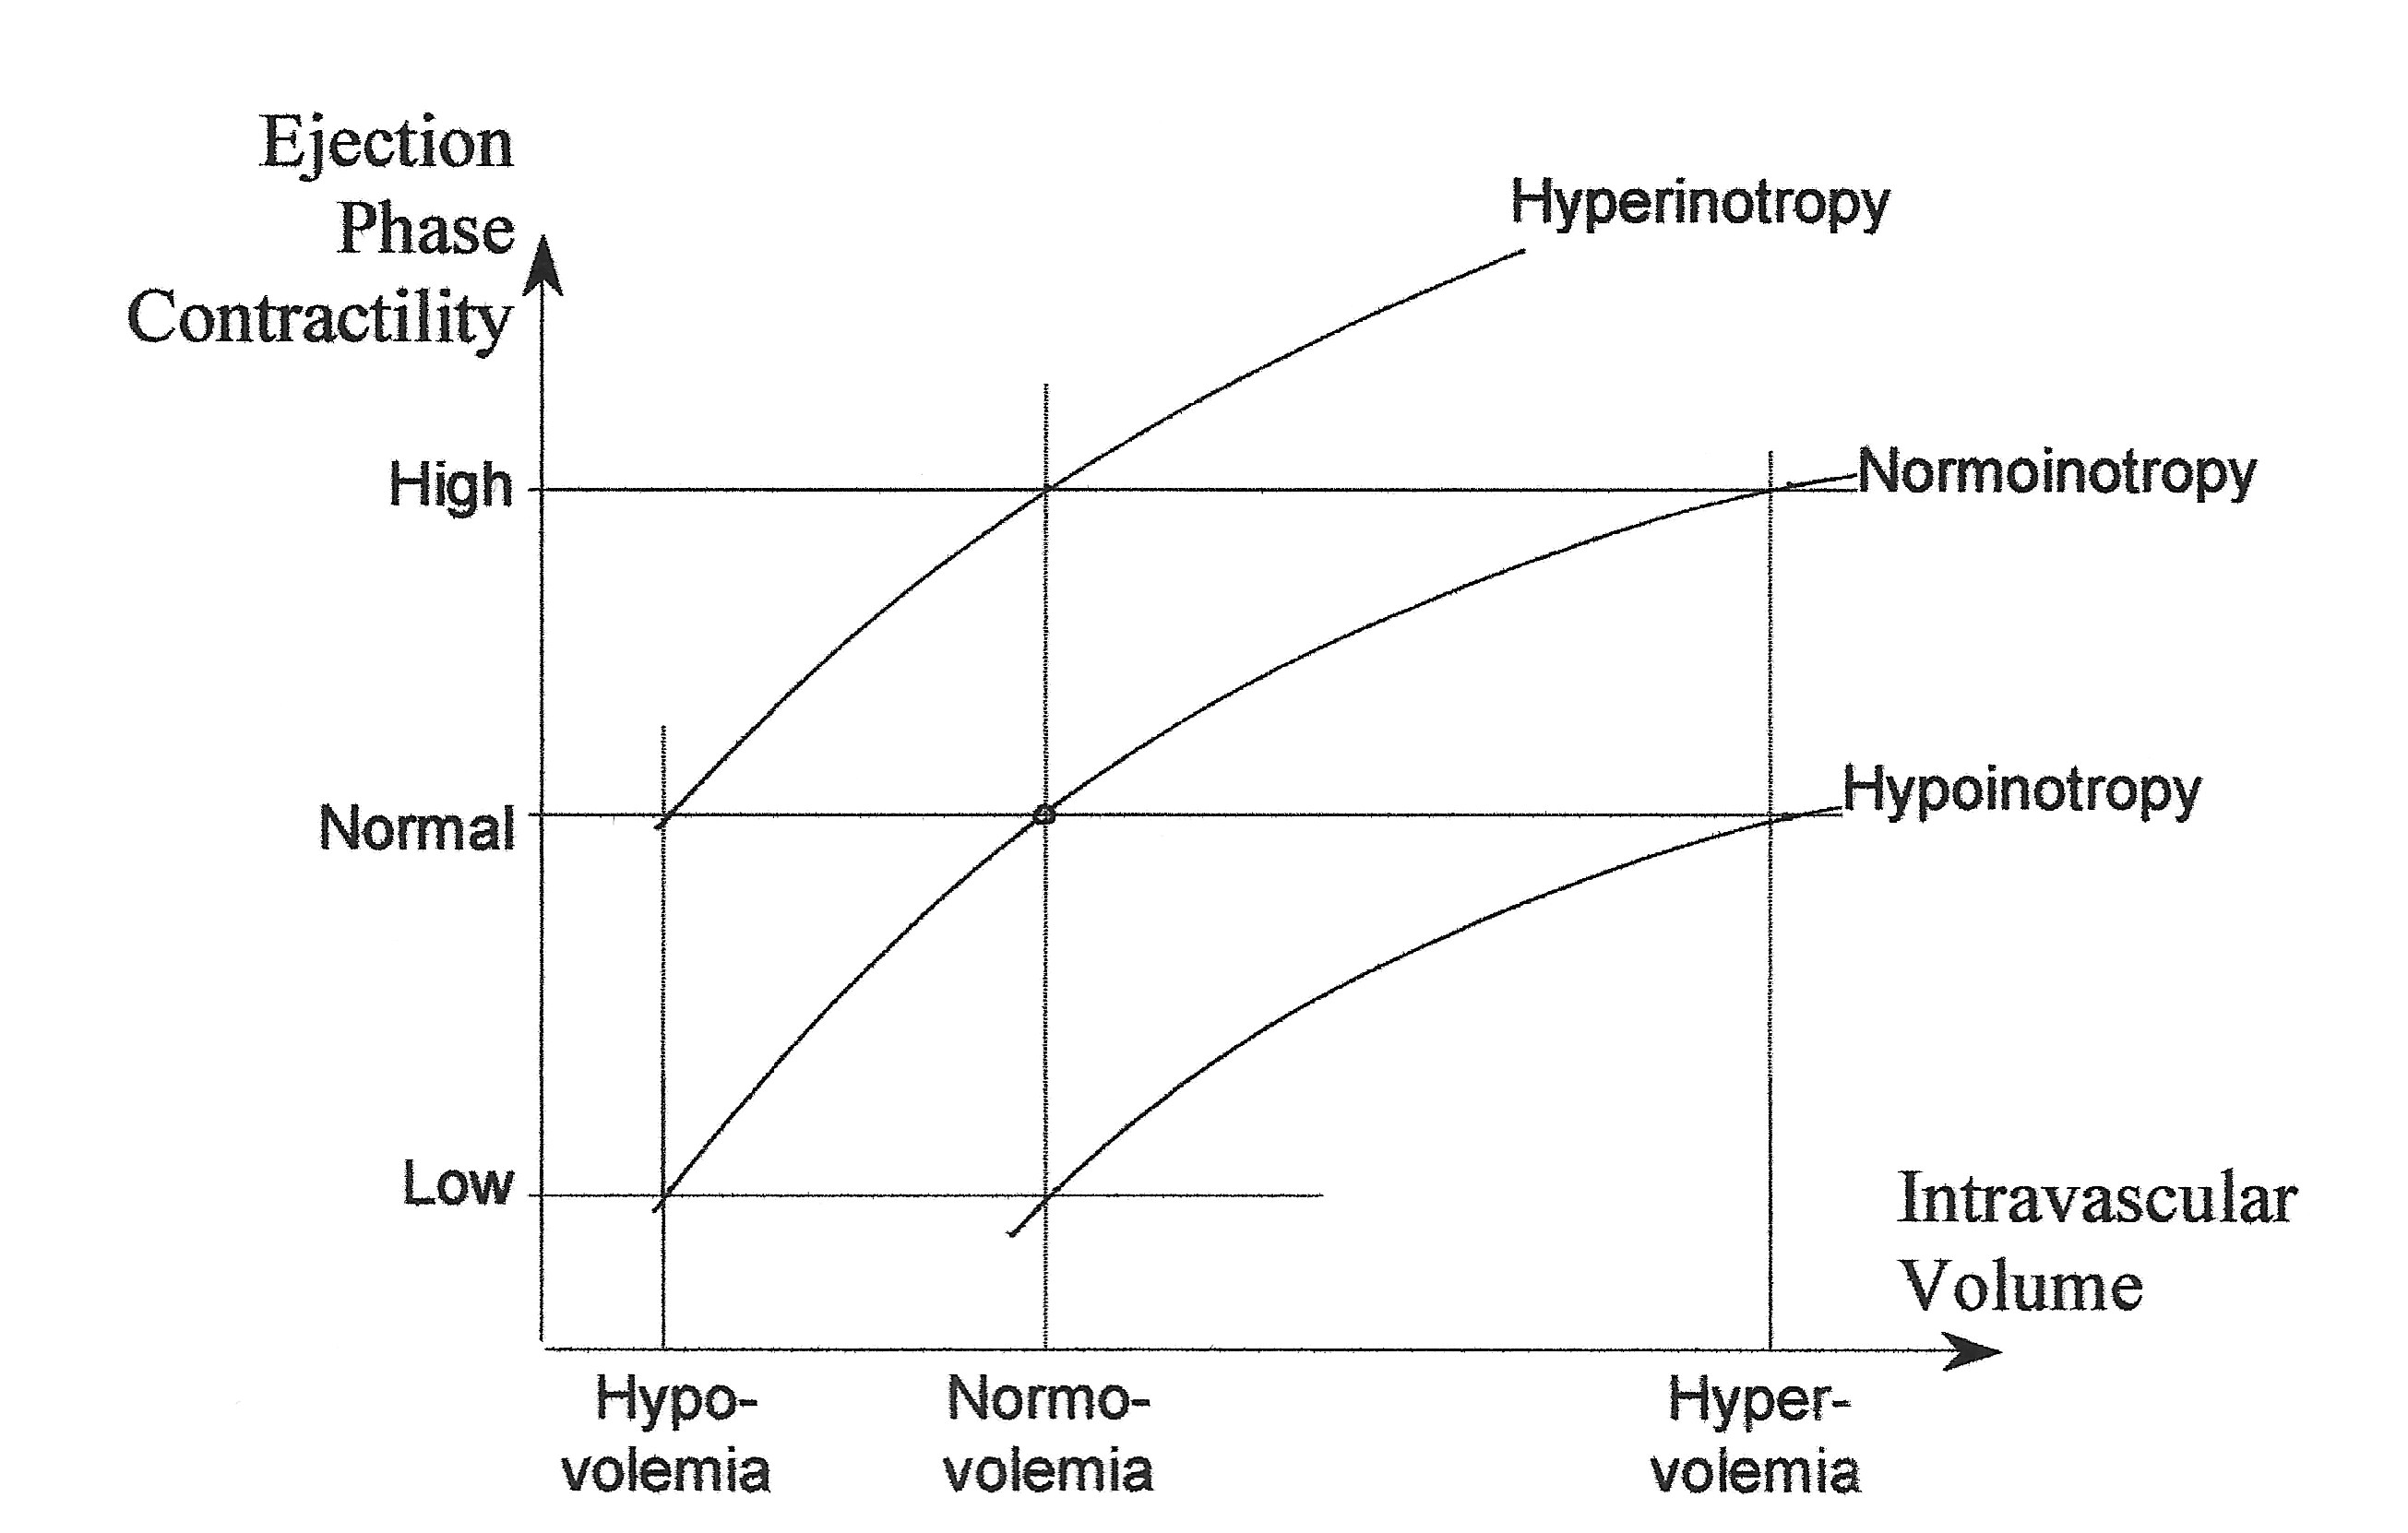
Contractility (inotropy) is force at a fixed preload — increased by catecholamines (β₁ → ↑ intracellular Ca²⁺), digoxin, and higher heart rate; decreased by β-blockers, heart failure, hypoxia/acidosis.
The Guyton framework plots two curves against right atrial pressure: the cardiac (Starling) curve (CO rises with preload) and the vascular / venous-return curve (venous return falls as RAP rises). Their intersection is the operating point. The venous-return curve hits zero flow at the mean systemic filling pressure (~7 mmHg) — the pressure with the heart stopped; it rises with volume loading or venoconstriction and falls with hemorrhage.
- SV = EDV − ESV; set by preload, afterload, contractility
- ↑ Preload → ↑EDV → wider PV loop, ↑SV (move along the same Starling curve)
- ↑ Contractility → Starling curve shifts up/left (↑SV, ↓ESV); ↓contractility shifts down/right
- ↑ Afterload → ↓SV, ↑ESV (PV loop taller and narrower)
- Mean systemic filling pressure ~7 mmHg = x-intercept of the venous-return curve (VR = 0)
- ↑ Blood volume / venoconstriction → ↑MSFP → VR curve shifts right → ↑CO
- ↑ TPR (arteriolar constriction) → ↓ slope of the VR curve → less venous return at any RAP
- Right atrial pressure ≈ central venous pressure ≈ preload surrogate
Hormonal control of blood pressure & volume
| Hormone | Trigger / source | Renal & vascular actions | Net effect |
|---|---|---|---|
| Renin | JG cells: ↓renal perfusion, ↓NaCl at macula densa, ↑β₁ sympathetic tone | Cleaves angiotensinogen → angiotensin I | Initiates RAAS → ↑BP |
| Angiotensin II | ACE (lung) converts AT I → AT II | Vasoconstriction (↑TPR); constricts efferent arteriole (preserves GFR); ↑ proximal Na⁺/H⁺ reabsorption; stimulates aldosterone, ADH, thirst | ↑↑BP, ↑volume |
| Aldosterone | AT II, hyperkalemia → zona glomerulosa | Principal cells: ↑ENaC Na⁺ reabsorption + ↑K⁺ secretion; α-intercalated cells: ↑H⁺ secretion | ↑volume, ↑BP |
| ADH (vasopressin) | ↑plasma osmolality, ↓volume/BP | V2 → aquaporins → water reabsorption (collecting duct); V1 → vasoconstriction | ↑volume, ↑BP |
| ANP / BNP | Atrial/ventricular stretch (volume overload) | ↑GFR (dilates afferent, constricts efferent), natriuresis; ↓renin, ↓aldosterone; vasodilation via cGMP | ↓BP, ↓volume |

Neural reflex control: baro-, chemo-, and Cushing
Beat-to-beat pressure is guarded by the baroreceptor reflex. Stretch-sensitive receptors in the carotid sinus (afferent via CN IX, glossopharyngeal / Hering's nerve) and the aortic arch (afferent via CN X, vagus) project to the nucleus tractus solitarius. A rise in BP increases stretch and firing → ↑parasympathetic, ↓sympathetic → ↓HR, ↓contractility, vasodilation → BP falls. A fall in BP (hemorrhage, standing) reduces firing → sympathetic surge → tachycardia, vasoconstriction, venoconstriction. Note: the carotid sinus responds to both increases and decreases in pressure, whereas the aortic arch transmits only increases; carotid-sinus massage raises firing and can slow the heart in SVT.
Peripheral chemoreceptors (carotid and aortic bodies) fire with PO₂ < 60 mmHg, ↑PCO₂, or ↓pH; central chemoreceptors in the medulla respond to CSF pH/PCO₂ (not directly to PO₂). The Cushing reflex: ↑intracranial pressure → cerebral ischemia/↑CO₂ → sympathetic vasoconstriction → hypertension, which triggers baroreflex bradycardia, plus irregular respirations — the Cushing triad.
- Aortic stenosis — a fixed valvular obstruction ↑afterload; forward SV falls and ejection is slowed → pulsus parvus et tardus (weak, delayed carotid upstroke) and a narrow pulse pressure, with a crescendo–decrescendo systolic murmur and exertional syncope/angina. Chronic pressure overload → concentric LV hypertrophy.
- Aortic regurgitation — diastolic runoff back into the LV drops diastolic pressure while raising SV → wide pulse pressure with bounding "water-hammer" (Corrigan) pulses and head-bobbing (de Musset sign).
- Renovascular hypertension — a stenotic renal artery lowers perfusion pressure at that kidney → ↑renin → angiotensin II/aldosterone → secondary HTN, sometimes with flash pulmonary edema and an abdominal bruit (fibromuscular dysplasia in young women; atherosclerosis in older adults).
- Orthostatic hypotension — on standing, ~500 mL pools in the legs → ↓venous return → ↓BP; when the baroreflex fails (autonomic neuropathy in diabetes, aging, volume depletion, or drugs) it cannot compensate → a drop of ≥20 mmHg systolic or ≥10 mmHg diastolic within 3 min of standing, with lightheadedness.
- MAP = DBP + ⅓ pulse pressure — diastole is weighted more because at resting heart rate the heart spends ~⅔ of the cycle in diastole.
- Baroreceptor afferents — "sinus = 9, arch = 10": carotid sinus → CN IX (glossopharyngeal / Hering's nerve); aortic arch → CN X (vagus).
- Poiseuille radius rule — "r to the 4th": R ∝ 1/r⁴, so doubling the radius raises flow ~16×; arterioles set resistance.
- Pulse pressure — Wide vs Narrow: Wide = aortic Regurgitation, stiff/aged aorta, hyperthyroidism, anxiety; Narrow = aortic Stenosis, cardiac tamponade, heart failure/cardiogenic shock, hypovolemia.
Practice Physiology now
Board-style questions, spaced-repetition flashcards, and a Socratic AI tutor — free to start.